

Capitalism Upon COVID-19
by IBON Media & Communications
The pandemic, by far the biggest global and national event this year, is accelerating long-standing systemic problems and processes. COVID-19 has already infected 79 million people and caused over 1.7 million deaths globally. The biggest number of stricken and dying are in the US, India, Brazil, Russia and France which cumulatively account for over half of cases and nearly half of deaths. In recent months, the most new cases and deaths are coming from the Americas and Southeast Asia. Yet the pandemic is still unfolding with renewed waves of infections in the USA, Europe and elsewhere.
The pandemic’s impact drew attention to many of the worst aspects of the world capitalist system – inadequate health care systems, vast inequalities in income, wealth and conditions, gaps in essential goods and services, economic resources going to non-essentials, environmental impact of economic activities, disproportionate burdens on the working class, regressive fiscal systems, authoritarianism, racism and xenophobia, and more. These are all pre-existing conditions but, for many, were seen in a new light.
Overall economic situation
The 2008-09 crisis firmly ended some three decades of generally increasing economic growth and ushered in a decade of global economic stagnation. The pandemic shock comes on top of this and makes economic conditions even more unstable.
Chart 1: Global real GDP growth, 1980-2020e (%)

The International Monetary Fund (IMF) expects the global economy to contract with GDP growth falling to -4.4% in 2020 before rebounding with 5.2% growth in 2021 (see Chart 1); UNCTAD sees -4.3% in 2020 with a weaker rebound to 4.1% in 2021. Containment measures will continue to depress economic activity aside from possible further shocks if the pandemic continues to spread or accelerate in places. This uncertainty makes global growth prospects uncertain despite the initial rebound as lockdowns were eased.
The IMF estimates that the pandemic shock will cost the world economy US$28 trillion in lost output over the next five years. This is equivalent to over a third of the global economy or the economic output of Japan, Germany, India, UK, France, Brazil, Italy, Canada, Russia, South Korea, Australia and Spain combined in 2019.
More vulnerable to disruption because of their domestically integrated economies and extensive global supply chains, the advanced capitalist countries are projected to have -5.8% growth in 2020 with a 3.9% rebound in 2021. The underdeveloped countries with more backward economies are projected to have growth rates of -3.3% and 6%, respectively. It is however notable that they are cumulatively contracting this year unlike in 2008-09 when they still had positive growth as a whole. In particular, even the so-called East Asian miracle economies are seeing their first combined contraction in six decades.
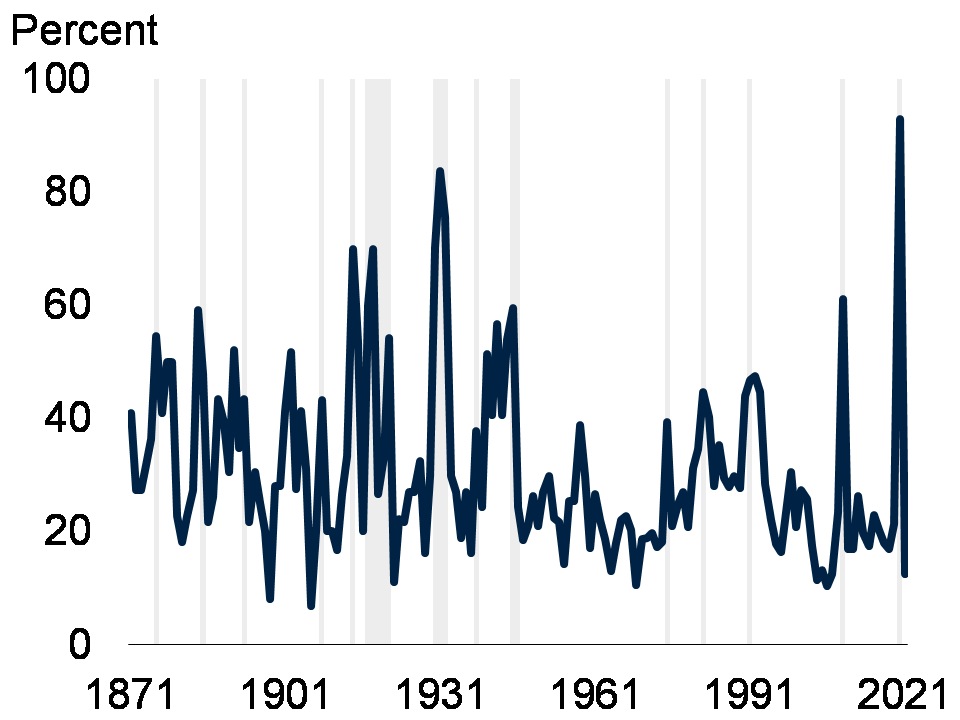
Government measures to contain COVID-19 caused the deepest non-wartime related global recession since the Great Depression in the 1930s that eventually led to World War II. (See Chart 2) However, today’s recession is more widespread than in the 1930s with the most economies simultaneously contracting in history. The recession in 2020 will also be more than twice as deep as the recession from the 2008/09 financial and economic crisis. (See Chart 3)
Chart 2: Global per capita GDP growth, recession years (%)
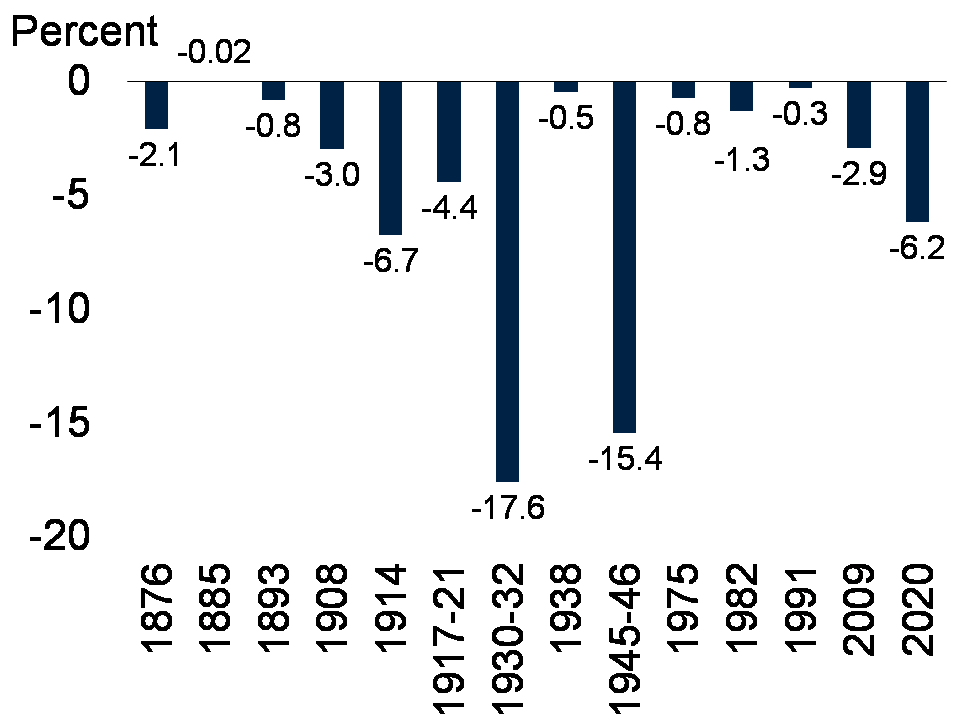
Chart 3: Economies with contractions in per capita GDP (% of total economies)
Some observations can be made about major trends upon COVID-19.
Pandemic shock the same but also unique
The COVID-19 pandemic is a direct result of the very same processes that have driven the global capitalist system into deeper crises especially since 2008/09 – the anarchic expansion of monopoly capitalism amid the system’s irresolvable crisis of overproduction.
In 2008/09, the bloating of fictitious capital to artificially boost demand and increase profits resulted in a financial meltdown, a global crisis, and the protracted slowdown. Financial contagion spread quickly through the circuits of capital built up during financialization of the neoliberal era before hitting the real economy. As such, the biggest hit was on advanced capitalist economies with globally inter-connected financial sectors. This quickly affected their real economies which eventually spread through their trade, investment, and migration links with the underdeveloped countries.
In 2020, the relentless profit-driven expansion into the natural environment resulted in COVID-19 as the latest zoonotic disease to emerge. The real economy in both the advanced capitalist economies and the rest of the world was immediately and severely hit because of the unprecedentedly quick spread of the disease – from people travelling more and faster with globalization – and from containment measures being simultaneously implemented worldwide. There was further economic contagion from the widespread disruption of extensive global supply chains created during the neoliberal era.
The pandemic is however unique among the 14 global recessions in the age of imperialism. The majority or ten (10) recessions were mainly due to crises exploding from the intrinsic economic contradictions of capitalism: 1876, 1885, 1893, 1908, 1930-32, 1938, 1975, 1982, 1991, and 2009. These recessions basically occurred because of uncontainable economic pressures or imbalances erupting in the system and disturbing economic activity. They were the end result of overproduction-driven internal imbalances such as overinvestment or unpayable debt so returning to ‘normalcy’ or a degree of stability meant having to resolve or work through these imbalances.
After the 2008-09 crisis, for instance, investment had to slacken to shed excess capacity and labor had to cheapen to restore average profit rates. At the same time, debt continued to grow to fuel demand and financial profits. This bloating debt was managed with a combination of reduced consumption, austerity, corporate bailouts, and financial regulations – and especially by relying on public debt rather than private debt (because of the conventional view that governments don’t go bankrupt and so sovereign defaults are rare). Yet though seemingly ‘managed’ the problem of debt bloating to record highs is the seed of financial turmoil down the line.
Another three (3) recessions were wartime-related: the 1914 recession was pre-World War I but triggered by fears of a major war in Europe following the assassination of Archduke Franz Ferdinand; and the 1917-21 and 1945-46 recessions were due to transitions back to peacetime production from a war economy (with the former compounded by the Spanish Flu pandemic). The destruction of productive forces during the world wars was however more literal and widespread even as production capacity among the countries fighting received a wartime boost.
The 2020 global recession is the only one resulting from government policy choices around the world to intentionally restrict economic activity to contain the spread of the coronavirus. The disruption from global lockdowns, travel restrictions, and other containment measures was in this sense externally-driven rather than from internal economic imbalances. Still, the disruption was severe enough to drive economic activity to historic lows.
The current crisis is not yet the result of internal economic pressures or imbalances per se – unlike previous non-wartime related recessions such as recently in 2001 and in 2008 – so while such pressures and imbalances certainly continued to mount they have not yet reached the point that they are the primary problems to work through or resolve.
This is likely the reasoning underlying more optimistic forecasts which assume that lifting lockdowns, easing quarantine measures, and the availability of a vaccine soon will go far towards making economies recover from the enforced slowdown in economic activity and its aftereffects. The thinking here is that widespread vaccinations over the next 1-2 years will be effective enough to completely end the pandemic and the main problem is just how economic activity will be constrained by social distancing until then.
This view however significantly overlooks or downplays many risks from the ‘external’ disruption that intensify pre-existing internal economic pressures and imbalances. The generalized quarantine measures have resulted in processes that are together bringing these pressures and imbalances closer to the point of erupting into a systemic crisis with generalized economic and financial meltdowns.
In general, there are three main sources of possible flashpoints: 1) the impact on the real economy; 2) the unprecedented bloating of debt which lays the basis for a financial and economic upheaval even greater than in 2008-09; and 3) from chronic conflicts in the imperialist system (such as between the imperialist powers, or between capital and labor).
Impact on the real economy
The speed and severity of the economic contractions from COVID-19 containment measures in the first half of the year is unprecedented. Measures started to be eased since the middle of the year so economic activity has rebounded somewhat. However: 1) varying degrees of containment measures including renewed lockdowns can still happen as second and third waves of the pandemic occur such as in the US and Europe; and 2) the structural damage to economies is just emerging and will continue. The economic impact will also become clearer as government support eventually weakens.
The basic danger is that the widespread destruction of productive forces in the first half of 2020 and still to come is so bad that pre-existing imbalances worsen to the point of erupting into a systemic crisis. This can happen with: too many firms going bankrupt, not reopening, and productive capacity collapsing; unemployment staying too high, incomes falling, and too many households falling into distress; and the banking and financial system correspondingly crashing.
There was a generalized across-the-board collapse in economic activity. The impact on sectors in terms of severity and prospects for rebounding/recovery varies depending on how essential the good/service is and how much social distancing affects how they’re produced or consumed. Globally, essentials such as food (and agriculture), utilities and financial services have been least disrupted.
The worst affected sectors are transportation (especially air travel), hotels and restaurants, retail trade, and recreation/leisure. Many underdeveloped countries are over-dependent on tourism which cuts across all these sectors. They will have difficulty recovering as long as concerns over exposure to COVID-19 linger (i.e. absent widespread vaccination or even herd immunity). Hundreds of millions of jobs worldwide have been lost in these sectors which will remain unviable for years to come. The International Air Transport Association (IATA) has already estimated that some 25 million employed in the aviation industry may lose their jobs from the collapse in air travel. Overall, the World Travel and Tourism Council (WTTC) estimates up to 50 million travel and tourism jobs at risk.
The oil industry and oil exporters are however also badly affected with the demand for fuels and prices falling in line with the collapse in economic activity. Oil prices have already fallen from around US$61 per barrel in 2019 to around US$41 today.
The impact on manufacturing is mixed. Initially, the generalized disruption of now expansive global supply chains was far-reaching. Some subsectors resumed as lockdowns eased but many others still could not immediately bounce back. Subsectors related to the worst affected sectors are in the most difficulty such as aerospace and related industries. The automobile and other consumer durable goods industries have supposedly done better but sales are still weak; many households hit by job losses and uncertain incomes are no longer making big purchases.
Foreign direct investment (FDI) can be used as a rough proxy for investments in the real economy (even if FDI may include mergers and acquisitions and does not reflect other domestic investments). Global FDI flows were already weakening even before the pandemic from US$2 trillion in 2015 to US$1.6 trillion in 2019 – indicating that global economic activity was drastically slowing even before COVID-19 containment measures. (See Charts 4 and 5) UNCTAD now sees global FDI flows falling even further to below US$1 trillion in 2020 which is as low as before 2005. FDI is projected to decrease further in 2021 and will supposedly only begin to recover in 2022 at the earliest.
Chart 4: Average annual growth in FDI, 1990-2018 (%)
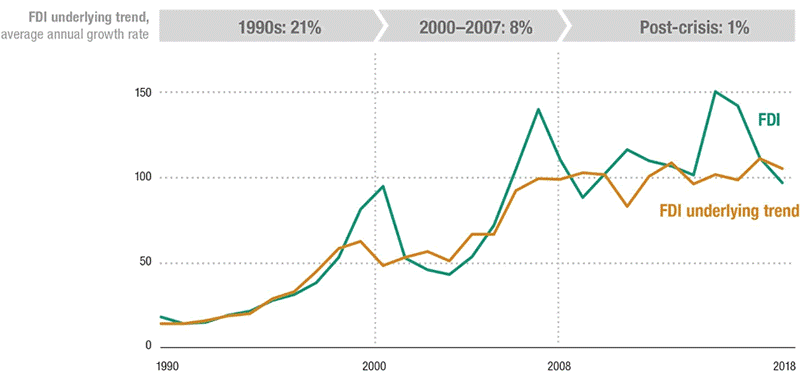
Chart 5: Global FDI inflows by group of economies, 1995-2015 (US$ billion)
On the other hand, financial investments kept growing. (See Chart 6) These are overwhelmingly financial assets that, unlike tangible productive investments, do not have inherent physical worth or form.
Chart 6: Total assets of financial institutions worldwide
by institution type, 2002-2018 (US$ trillion)

The bloating of fictitious capital in the run-up to 2008-09 was the biggest factor in the unsustainable gap between the financial economy and the real economy. The extreme financialization led to an excessively wide gap and the 2008-09 financial crisis. More and more profits came from financial instruments rather than real production. Such bloated financial profits vastly increased the economic and political power of the financial sector as well as further skewed economies away from producing for people’s needs.
This wide gap did not really narrow after 2008-09 because of relentless quantitative easing (QE) and stagnant real economies. It will only grow even wider today with extremely low interest rates that keep asset prices high amid real economies weakened by joblessness, closures, and low incomes.
Again, debt to deal with capitalist crisis
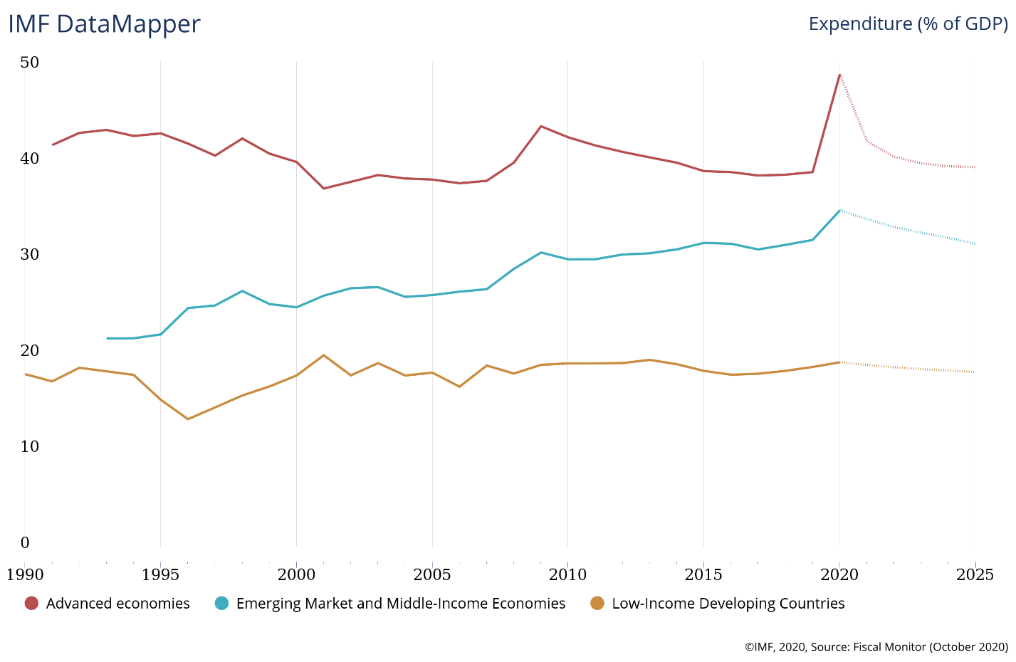
Governments undertaking unprecedented fiscal responses to deal with the pandemic-driven economic contractions have driven global debt levels to even greater historic highs. The IMF reports that governments have committed US$11.7 trillion to deal with the pandemic and economic collapse – equivalent to some 12% of global GDP and which is nearly the size of the Japanese, German and French economies combined. Economic stimulus responses today are many times over those during the 2008 financial crisis. (See Charts 7 and 8)
Chart 7: Economic stimulus responses, 2008 and 2020 (% of GDP)
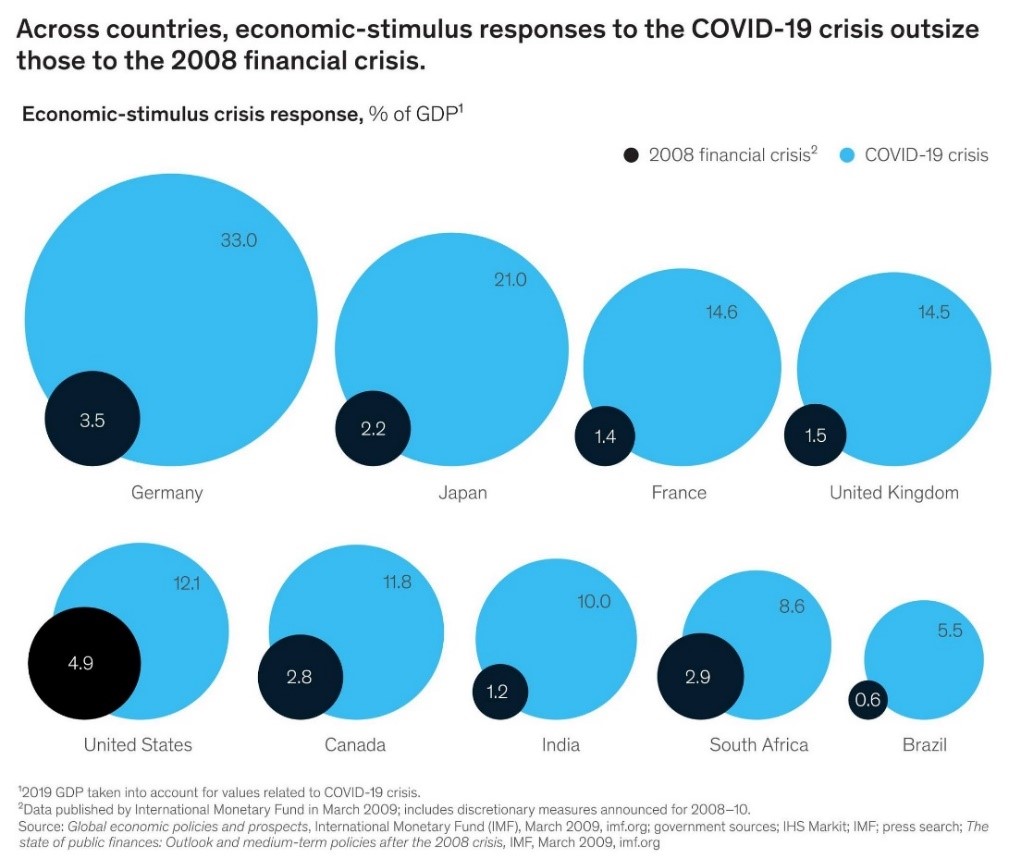
Chart 8: Government expenditure, 1990-2020e (% of GDP)
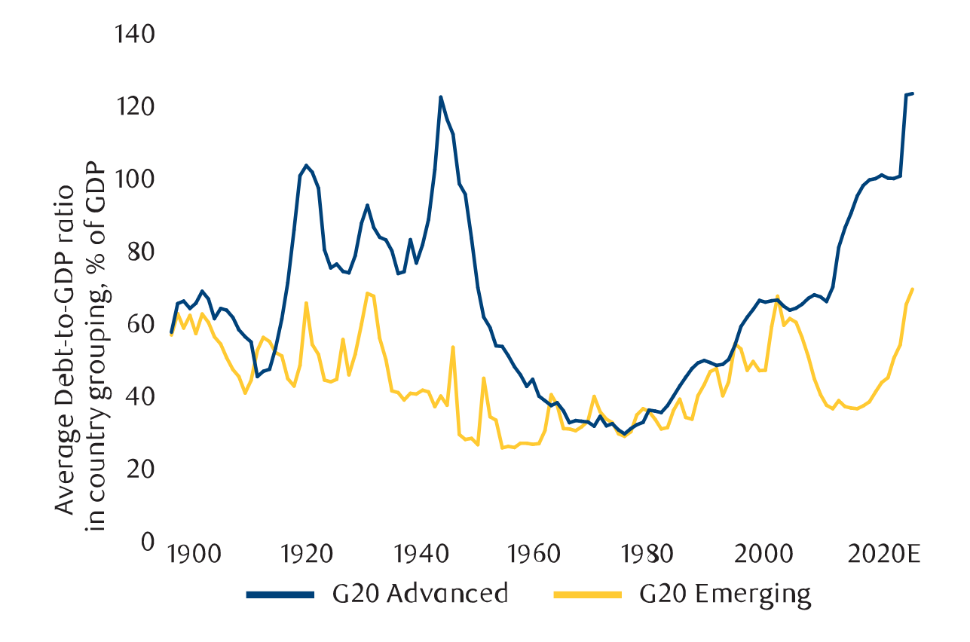
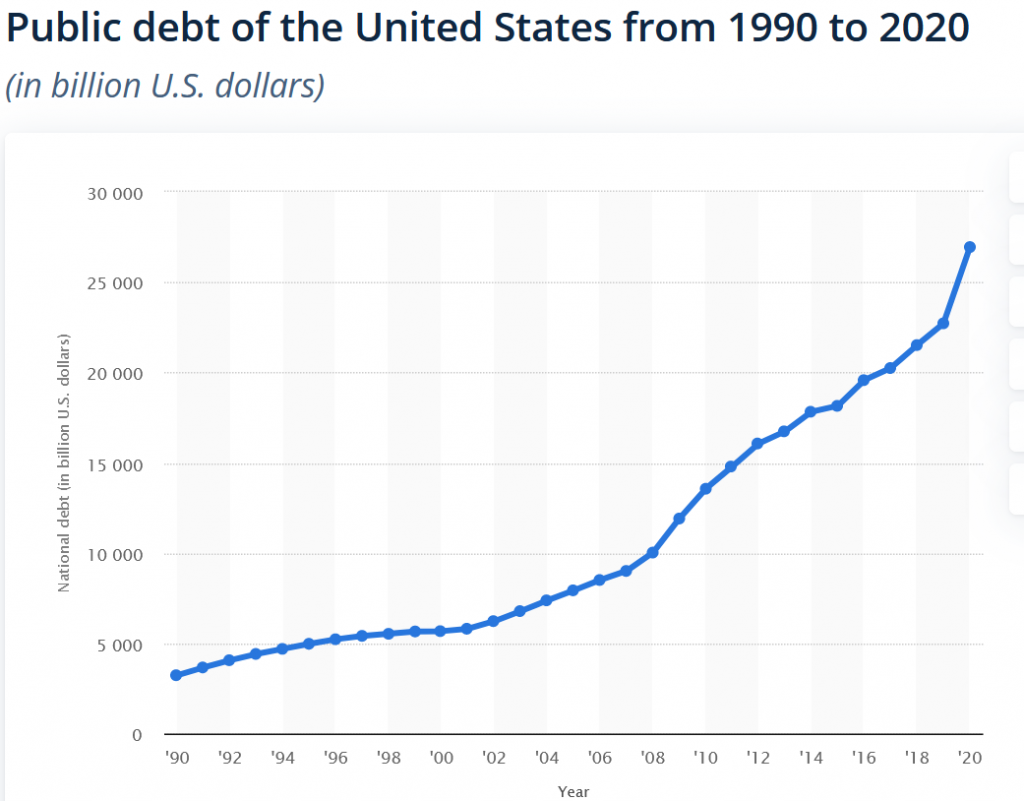
There is unprecedented government debt. The bloating of public debt to finance stimulus packages makes sovereign defaults a particular point of concern. The IMF sees public debt in the advanced capitalist centers significantly rising from 105% of GDP in 2019 to 126% in 2020 and 2021 with the highest public debt levels in Japan (264% of GDP) and the US (134%). (See Chart 9) China, not considered an “advanced economy” by the IMF, sees its public debt increasing from 53% to 67% over that same period. Total public debt will be equivalent to 100% of the global economy in 2021. These are the highest levels of public debt to GDP ever recorded. In the US, public debt which accelerated after 2008 has spiked even further in 2020. (See Chart 10)
Chart 9: Public debt-to-GDP, 1900-2020e (%)
It is notable that central banks have emerged as major purchasers of government debt – the US Federal Reserve has taken up 57% of all US government debt issued since February 2020, the European Central Bank 71%, and the Bank of Japan 75% – which is basically monetizing fiscal deficits or printing more money to finance these. According to the IMF, the major central banks have in this way already injected over US$7.5 trillion into their economies which is an amount approaching one-tenth of the US$90 trillion global economy. The new money is driving interest rates to ever lower and even negative interest rates which will only tend to inflate asset price bubbles further.
Chart 10: Public debt of the US, 1990-2020e (US$ billion)
These efforts are continuous with massive efforts at QE to increase the money supply since 2008-09 that have actually just fueled speculation, stock markets, and asset prices. Large parts of cash injections went to the world’s biggest investment banks and financial institutions who used these for speculation and generating profits from financial and real estate investments instead of productive use in the real economy, improving working class welfare, and equitable and sustainable growth. This finance capitalism is a debt-driven system of speculative bubbles, bloated financial profits, and expanding fictitious capital.
Such large expansions of cash in the economy are normally seen as inflationary which is why there are limits to how governments have used these in the past. This is not yet resulting in such runaway inflation today partly because there is enough productivity and capacity to provide supply, but mainly because mass unemployment has caused household incomes to collapse so much that overall demand is substantially repressed with corresponding downward pressure on prices and inflation. This is worth highlighting because the intrinsic insufficiency of aggregate demand – the other side of overproduction in the capitalist system – is not being resolved by the growing debt.
Large parts of the debt in advanced capitalist countries are financing corporate bailouts or used by firms to finance speculation in financial markets instead of COVID response or social programs. The US and EU for instance have in effect also used their central banks to backstop or guarantee huge amounts of corporate debt.
There is unprecedented global debt. In 2019, total global debt was distributed among non-financial corporations (29%) and financial corporations (24%) followed by governments (27%) then households (19%); about 70% of global debt is in the advanced capitalist economies with the balance of 30% in underdeveloped countries.
Even before the pandemic, the wave of debt since the 2008-09 crisis was already the largest and involved the most countries in history. It exceeded the previous waves from 1970-1989, 1990-2001, and 2002-2009 which all ended in financial crises. The pandemic brings this debt to ever greater historic highs. (See Chart 11)
Chart 11: Total global debt, 2013-2020e (% of GDP)
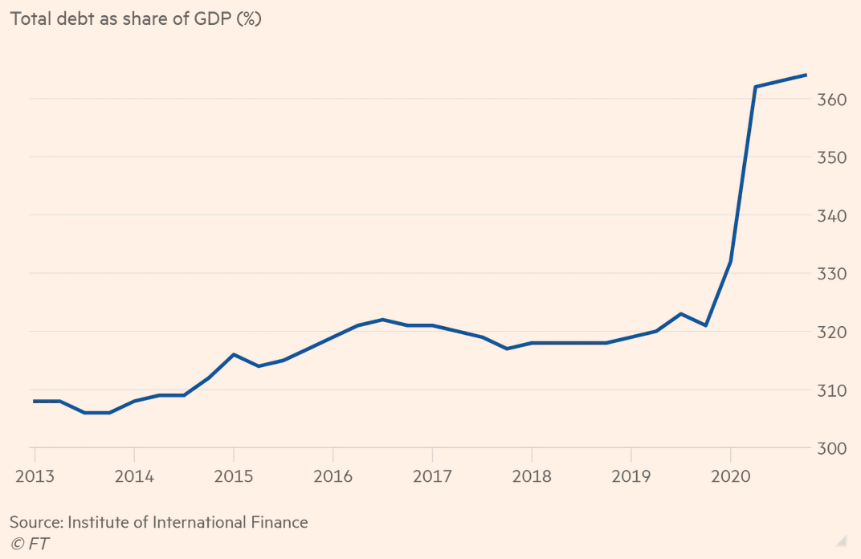
The Institute of International Finance (IIF) already noted that global debt increasing by over US$52 trillion since 2016 is the most rapid debt buildup over four years on record, far outstripping the just US$6 trillion increase over the previous four years. As of September 2020, pandemic-driven debt ballooned by an additional $15 trillion to reach over US$272 trillion or around 360% of global GDP with governments accounting for nearly half the increase.
Total global debt (i.e. government, financial and non-financial companies, households) was already at a record US$255 trillion or 322% of global GDP in 2019, according to the IIF, and is estimated to reach US$277 trillion by the end of 2020 or equivalent to around 365% of global GDP.
Overall debt in the capitalist centers was up to 432% of GDP. Total US debt is likely to hit US$80 trillion in 2020 from US$71 trillion at the end of 2019, while Euro area debt will reach US$53 trillion; China’s debt could reach 335% of GDP in 2020. The total debt of the underdeveloped countries will hit around 248% of GDP.
Aside from public debt, corporate debt is also rising as firms take on new cheap loans to compensate for collapsing demand and markets. Just in the first quarter of 2020, financial and non-financial debt increased US$4.8 trillion from the same period the year before to US$139.9 trillion. By September, global non-financial corporate debt was over US$4.3 trillion higher than at the start of the year and reached a record high of almost US$80 trillion.
The explosion of debt is a desperate measure to support unprecedentedly crisis-ridden capitalism. However total debt-to-GDP and public debt-to-GDP ratios cannot keep on rising forever. The bloating debt will seem sustainable as long as there is a constant flow of money whether from expanding economies, financial profits, or indeed more debt. But this is an increasingly fragile situation and an interruption in any of these areas that triggers a cascade of debt defaults will set off a financial crisis.
There will never be enough economic growth to pay down such huge debt across countries, governments and sectors which means chronic conditions for mounting instability, growing vulnerability, and unprecedented financial and economic turmoil. Substantial wealth taxes may be able to prolong deficit spending and even repay debt but capitalist elites will not allow these to any significant degree.
The debt crisis of backward countries is worsening. Collapsing revenues and foreign exchange earnings amid the demands of domestic pandemic response compelled increased foreign borrowing and greater debt burdens. Banks and bondholders are however not giving any concessions while the IMF and official creditors only offer a few months of suspended debt servicing – and, even then, only to a few dozen mainly smaller economies.
The total external debt stocks of the underdeveloped nations (“developing countries and transition economies”) reached a record US$10.1 trillion in 2019; this was already more than double the US$4.3 trillion when the 2008-09 global financial crisis erupted. As it is, the IIF estimates that the underdeveloped countries (“low-income countries and middle-income”) will be making debt service payments on public external debt of US$700 billion-1.1 trillion in 2020 and 2021. Increasing shares of government budgets are going to public debt servicing.
Record debt burdens are bringing debt-distressed countries into a new period of austerity with certain cuts in essential, health, education and infrastructure spending. These will worsen social services for the people as well as erode backward economies further. New taxes are likely for poor populations in many countries while the accumulated wealth and incomes of domestic elites and foreign capital will remain untouched. The IMF and World Bank have already identified 36 debt-distressed countries especially underdeveloped countries made dependent on commodity exports and foreign tourism. Argentina, Ecuador, Lebanon, Suriname and Zambia have already defaulted on their sovereign debt.
Growing state intervention to support monopoly capitalist firms
The main relationship to consider remains labor versus capital rather than state versus market. The trend is not towards ‘state capitalism’, as if the political state has not always been intertwined with economic elites even during neoliberalism, but towards more overt use of the state and its resources in the interest of capital than before – through protectionism and through direct support for private firms. This already started accelerating after 2008-09 and will intensify further upon the pandemic and government economic responses.
Yet even while this is happening the imperialist-designed architecture of world trade and investment remains. International economic agreements and neocolonial policies, programs and laws built up under neoliberalism are still biased for monopoly capitalist profits and continue to drive plunder and underdevelopment.
Imperialism has always been two-faced in pushing free market policies of neoliberal globalization since the 1980s – opportunistic in pushing market-based policies on other countries and their own people when profitable, but protectionist and using state resources whenever needed. Among others, this is reflected in the steady weakening of the WTO and so-called multilateralism especially since 2008/09 when the imperialist countries all started to take more aggressive protectionist measures to support their corporations. The US in particular has been aggressive in circumventing the WTO and, by blocking its critical dispute settlements body, even sabotaging it. Britain has already opted for Brexit.
Coming into the pandemic, far more protectionist measures were already being implemented than liberalizing measures. (See Charts 12 and 13) The imperialist powers in the G7 are implementing the most protectionism – led by the US followed by the UK and Germany – but large underdeveloped countries like India and Brazil are also intervening. China and Russia have always been heavy users of interventionist policies and are among those taking more protectionist steps. Protectionism however has spread across the G20 countries which cumulatively account for 90% of the global economy.
Chart 12: Number of new interventions implemented each year, 2019-2020
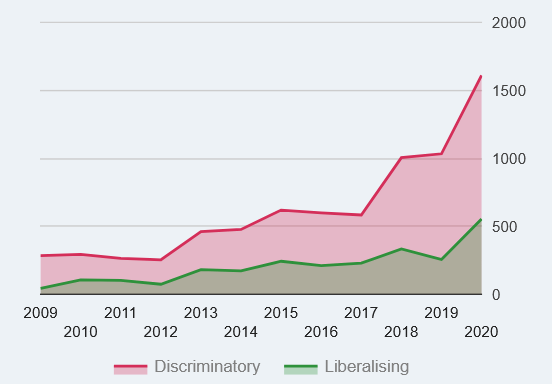
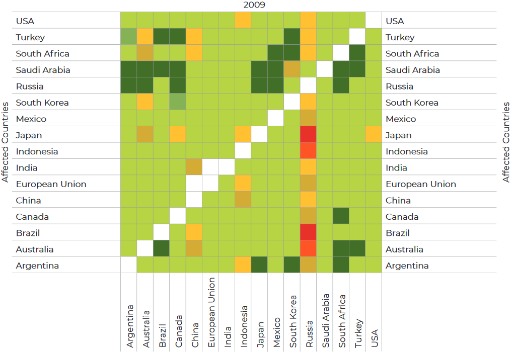
Chart 13: Incidence of G20 trade measures, 2009 and 2020
2009
2020
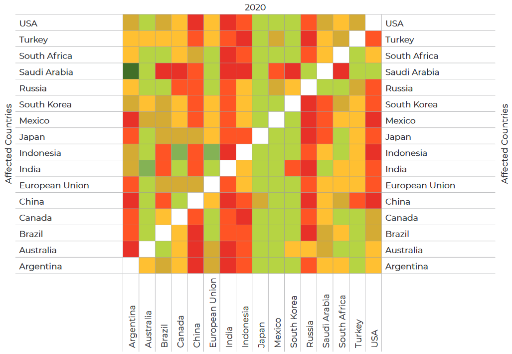
Percentage of bilateral exports facing importers’ trade distortions
Protectionist measures have been growing in a wide range of sectors and products spanning not just obvious tariff barriers but also relatively more invisible non-tariff barriers. The most measures have been in basic industries – products of iron, steel and other fabricated metals, motor vehicles, machinery, electrical equipment, chemicals, and pharmaceuticals – but also in many food and agricultural products.
The pandemic gives governments including of the advanced capitalist powers a serviceable pretext for even more protectionism. The imposition of export restrictions on medical supplies and equipment and on food by so many countries around the world – including the large economies of the US, EU, Russia, India, Brazil, and others – highlighted the self-interest underpinning all foreign economic trade relations. These and more will greatly intensify inter-imperialist rivalries.
The US and China account for over two-fifths of the global economy and entered the pandemic while already in the middle of a trade and technology war since 2018. Under an “America First” banner, the US has been particularly aggressive in restricting trade and investment with China and especially blocking its access to technology. Among others, it blocked the use of Chinese 5G technology and disallowed Chinese investors that might learn semiconductor technologies. But the US has also been restricting trade even with supposed allies EU and Japan.
With the pandemic, the US started encouraging firms to relocate and diversify their supply chains from China to, for example, Mexico or Vietnam; it is coordinating with the governments of Japan, UK and Australia on this. US-China trade and investments have fallen but decoupling will be limited, at least in the short-term, given extensive trade and investment links built up in the last two decades. China is an important production platform for many US firms and a major market for US products and services.
China, on the other hand, has of course always ensured that the state has a dominant role in the economy. China’s economic expansion has been driven by state-owned enterprises, foreign investment restrictions, forced technology transfer or outright theft, and generous subsidies on companies and exports.
Still, in September 2020, the CPC-CC called for strengthening state control of the private sector “to build a backbone of private economic actors that are reliable and useful at critical moments”. The October 2020 plenum of the CC moreover saw affirmation of China’s “dual circulation” policy which means strengthening domestic capacity while also opening up global markets (such as through RCEP). China is being particularly aggressive in trying to counter global protectionism because its unequal and still basically low income internal market is not enough to absorb excess capacity and maintain industrial momentum.
Economic blocs will start tending to be formed particularly around the US and China. The US is already exploring the possibility of a new economic agreement for the Americas, possibly starting with additional bilateral agreements towards a single expansive one. The US currently has trade deals with Mexico-Canada and a number of countries in Latin America. It will have to deal with governments asserting independence from the US such as Bolivia, Cuba, Uruguay, and Venezuela.
China meanwhile has recently been able to conclude the RCEP with ASEAN, Japan, Australia, New Zealand and South Korea. With India opting out to protect its economy, China accounts for almost three-fifths (56%) of RCEP member economies combined. While in some ways less aggressive than previous US-driven FTAs – which merely reflects how China is limiting free market-based measures in RCEP too inconsistent with its economic model – RCEP nonetheless draws in its member countries closer to China’s orbit especially with the Trump administration’s withdrawal from the US-centered TPP.
At the same time, the pandemic economic shock is being used to compel governments of backward and underdeveloped economies to further open up to foreign trade and investment and to give even more incentives for foreign capital – supposedly for resiliency and to hasten recovery. The big powers are already mobilizing the rhetoric of “fairer globalization” and “more resilient multilateralism” to push their exploitative economic agenda.
The pandemic also gives governments a serviceable pretext for even more support to corporations using public resources. This will drive even greater concentration of production and accumulation of capital. Corporations and financial firms are directly gaining from various so-called pandemic response measures.
Monetary easing and liquidity measures cheapen financing/capital for corporations – liquidity injections by Central Banks already amount to over US$7.5 trillion, according to the IMF. Many banks and corporations, especially the largest ones, are using these to speculate in financial and stock markets rather than real investments. These are aside from governments giving firms hundreds of billions of dollars in tax cuts and direct payments (ex. wage subsidies) to boost cash flows and profits.
There is wide-ranging government support for corporate profit-seeking.
The global pharmaceutical industry reportedly had revenues worth US$1.3 trillion in 2019. Big pharmaceutical firms are already prospering from providing treatments and will prosper even more with the COVID-19 vaccines and other treatments being developed for what is the largest market for a vaccine in the history of the world. Vaccine producers worldwide are already receiving huge subsidies from governments and will be further supported later with government-funded distribution schemes.
The six reportedly front-running vaccine developers are getting US$12.3 billion in government subsidies: Moderna/Lonza (US$2.5 billion); Pfizer/BioNTech (US$2.5 billion); GlaxoSmithKline/Sanofi Pasteur (US$2.1 billion); AstraZeneca/Oxford University (US$1.7 billion); Johnson&Johnson/BiologicalE (US$1.5 billion), and Novavax/Serum Institute of India (US$2 billion). The US government has reportedly allotted almost US$10 billion to produce and deliver 300 million doses of COVID-19 vaccines by early 2021.
COVID-19 vaccines are going to be priced exorbitantly and be worth hundreds of billions of dollars to the big pharmaceutical firms. At two doses each, as much as 14 billion vaccines will be needed to immunize everyone in the world. The profit stream will also continue for years if, as is expected, vaccine-produced immunity wanes and booster shots are needed.
Other industries are also getting substantial government support. This includes for all-important high technology firms – not just ICT companies but especially new emerging technologies opening up new products and labor-saving methods (ex. robotics, artificial intelligence, 3D printing, nanotechnology, neurotechnology, biotechnology, quantum computing, energy storage). There is also greatly expanded support for infrastructure projects worldwide which is often also justified as support for so-called green infrastructure and low-carbon development to help combat climate change.
China, for instance has announced a US$1.4 trillion government “new infrastructure” plan to develop and promote 5G, smart cities, and other technology infrastructure. This is actually a key part of its overall drive for technological “self-sufficiency/self-reliance” by achieving major breakthroughs in “crucial/key/core” technologies by 2035 (e.g. AI/quantum computing, energy, telecommunications, high speed rail) and becoming a manufacturing cyber and digital economy powerhouse.
Shifts in the globalization of production
Growing protectionism may be the initial stages of a shift of industrial production back to the centers of monopoly capitalism. The concentration and centralization of capital on a global scale accelerated in the 1950s and 1960s as monopoly capitalist firms set up foreign subsidiaries. This globally interlinked production reached new heights with neoliberal globalization and global supply chains (also called global value chains, or GVCs).
Over the last four decades of globalization, monopoly capitalism offshored increasing portions of its manufacturing and services to the backward countries to take advantage of cheap labor abroad. GVCs were created, expanded and deepened for transferring even more surplus value to the imperialist countries.
More extensive global supply chains were made possible by developments in ICT, cheaper transport, and tighter control of technologies (such as through intellectual property laws and regulations). These allowed monopoly capitalist firms to locate more of their operations abroad as well as to engage arms-length domestic and other subcontractors (i.e. beyond established foreign subsidiaries). Monopoly capitalists remained the ‘lead’ firms making the most profits with globally dispersed production and multiple dense tiers of subcontractors. The integration of China and the former Soviet bloc countries was also particularly effective in greatly expanding the global cheap labor force for capitalist exploitation.
Global supply chains expanded rapidly from the 1980s until the 2008-09 crisis after which trade and FDI fell. TNCs used GVCs to attain maximum profitability from low wages vis-à-vis productivity, generous fiscal incentives, and lower costs of transport and raw materials. Foreign capital created pockets of low value-added manufacturing and natural resource extraction in many countries. This also conjured the illusion of development in the backward countries where shallow growth, increasing manufacturing employment and growing manufacturing exports hid the accelerated decline of domestic industries, backwardness of agriculture, and persistent export of natural resources.
The pandemic-driven shock to global supply chains and growing protectionism is triggering another round of reorganization of world production. Monopoly capitalism will still keep operations abroad in their perpetual search for the most exploitative labor conditions and lowest unit labor costs worldwide. Many if not all of the biggest US, European and Japanese TNCs already employ more workers abroad – in huge export and special economic zones including indirectly through their captive subcontractors – than in their home countries.
The immense and complex web of hundreds of large and small suppliers spread out across dozens of countries to profitably produce single products or services will not be dismantled. These are critical for generating profits and monopoly capitalists will ensure that they are disrupted as a little as possible. The imperialist powers have tried to protect supply chains as much as possible and have moderated the collapse in trade to less than in 2008-09, according to the WTO.
China in particular has come to have a central role in the world’s supply chains. This is partly reflected in how its share of inflows of FDI have increased almost ten-fold from just around one percent in 1990 to some nine percent in 2019, and its share in global imports and exports increasing from around two percent to over 10% over that same period.
Nonetheless, it appears that a degree of reshoring of industrial production and services is being seriously reconsidered – if not back to home countries then at least to closer or more allied countries. This also reinforces trends towards the formation of new economic blocs. The US is reportedly considering a US$25 billion reshoring fund of tax breaks and subsidies. Japan in turn proposes a US$2.2 billion fund specifically for its manufacturers to shift production away from China and back to Japan.
Reshoring will still not necessarily increase domestic employment though because of the increasing use of robotics and sophisticated automation. Weak employment effects will only worsen how domestic aggregate demand is repressed by labor exploitation and inequality which adds pressure to intrinsic imbalances due to overproduction.
Technology- and information- firms even bigger and more powerful
Monopoly control of technology has always been important for firms to dominate industries and economies. Recent decades have however seen the conspicuous rise of information- and communication-related firms providing mainly intangible services (e.g. Microsoft, Amazon, Google, Facebook, Alibaba, Tencent). Some, like Apple, started as manufacturers but are now also into services. (Apple was valued at over US$2 trillion in August 2020, which is more than five times Philippine GDP last year and more than seven times the value of all listed Philippine companies)
Technology firms sit astride traditional industrial (e.g. auto, energy, chemical, pharmaceutical) and financial giants. Financial services, real estate, consumer and retail trade, and commodities remain huge sources of profits but these have apparently slowed with bigger increases by technology firms in recent years.
The greatly accelerated rise of so-called technology firms highlights how monopoly control of industrial technologies are central to the accumulation process. Smaller firms, aside from benefiting least from government supports and bailouts, are less able to make the technology investments needed which will further worsen concentration among the largest companies. The pandemic is moreover spurring increased regimentation of workers as well as their replacement with robotics, software and artificial intelligence.
Information technologies and communication services sectors are flourishing. Technology companies such as Apple, Microsoft, Amazon, Google (Alphabet), and Facebook are big beneficiaries of people staying or working from home more. They are the five largest publicly traded companies in the US: Apple (US$2.02 trillion stock market capitalization), Microsoft (US$1.62 trillion), Amazon (US$1.59 trillion), Google (Alphabet, US$1.19 trillion), and Facebook (US$789 billion). Their stocks rose 37% in the first seven months of 2020 while all the other stocks in the S&P 500 fell a combined six (6) percent. They now account for 20% of the stock market’s total worth which is the biggest concentration in a single industry in at least 70 years.
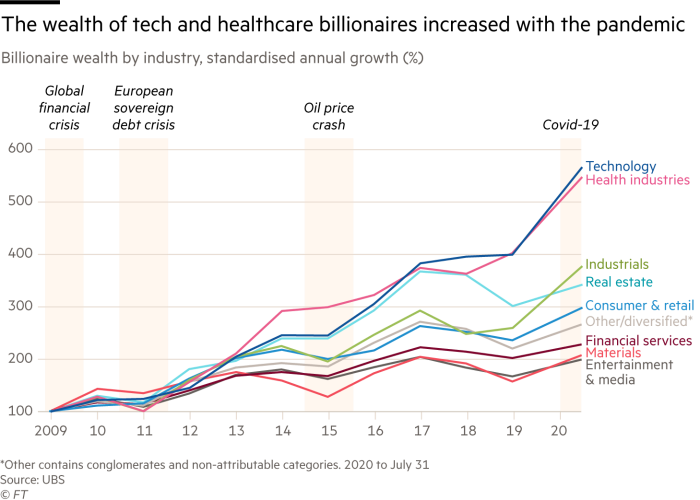
Correspondingly, billionaire wealth in technology firms has significantly spiked in 2020. (See Chart 14)
Chart 14: Billionaire wealth by industry (% standardized annual growth)
Still, stock valuations are fueled by financial speculation as much as by real value. Ranked by revenue according to Fortune’s Global 500 in 2020, the technology firms are less dominant: Amazon (9th globally), Apple (12th), Google (29th), Microsoft (47th), and Facebook (144th). The top 10 biggest firms by revenue are: Walmart, Sinopec Group, State Grid of China, China National Petroleum, Royal Dutch Shell, Saudi Aramco, Volkswagen, BP, Amazon, and Toyota.
Trade in ICT/telecommunications equipment – including consumer electronics such as smartphones, tablets and laptops – have continued as households, businesses and governments upgrade information technology infrastructure for remote and distance work. Media streaming companies such as Netflix also gained as households compensated for the lack of outside recreation activities.
China is further closing the economic gap with the US
The era of neoliberal globalization since the 1980s saw the relative weakening of US imperialism and the rise of China as an increasingly assertive global power. Chinese state monopoly capitalism has driven its economy to already be at least as large or even larger than the US economy, depending on how GDP is measured. China already has the most firms in the Fortune’s Global 500 at 124 followed the US (121 companies), Japan (53), France (31), and Germany (27).
China is seen by the US as an increasingly serious economic and military threat. By the start of the Trump administration, the US explicitly declared China and Russia (especially China) as the main global challenges to its superpower status and imperialist domination.
China’s industrial might made it encroach into sectors previously dominated and controlled by the traditional imperialist powers. Still, it eventually reached the limits of using cheap labor to drive its ‘competitiveness’ and industrial expansion and so it has become more aggressive in seeking technological advances to generate surplus value. It also needs larger export markets to realize this surplus value. China is pressured by how its economic growth has been generally falling from 10.6% in 2010 to just 6.1% in 2019. Even before COVID-19, China’s growth was already down to less than half the rates which were even as high as 14.2% relatively recently in 2007. These are the objective conditions for the US pushing back and the intensified US-China trade and technology war.
Still, in June 2020, China became the first major capitalist power to return to positive economic growth since the onset of COVID-19. Its economy is recovering from the pandemic demand and supply shock faster than the US and so is making some more gains in closing the economic gap with it. China is the only major power projected to have positive economic growth in 2020 and is seen to have the fastest growth by far in 2021.
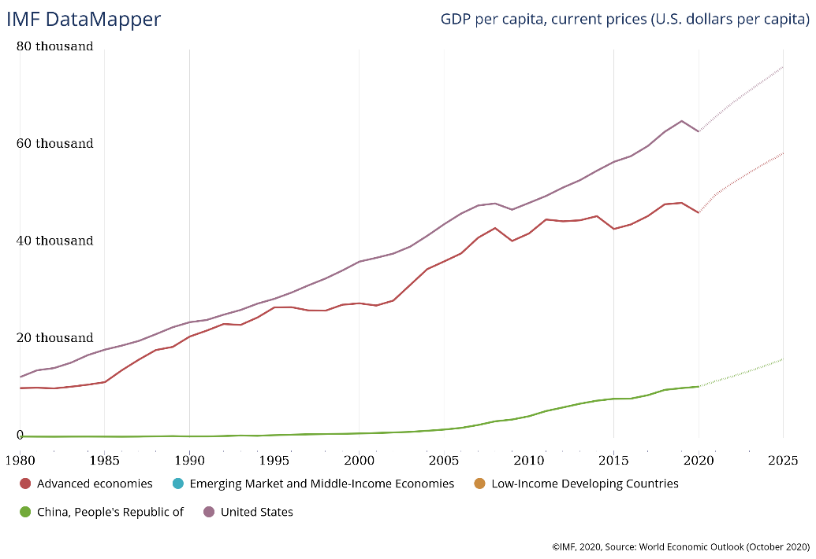
Measuring GDP at current prices, China’s share of the global economy increases from 16.6% in 2019 to a projected 18.7% by 2022; the US’s share on the other hand decreases from 24.7% to 23.9% over the same period. (See Chart 15) China however is still very much lagging in per capita terms with per capita GDP still just around one-sixth of the US’s. (See Chart 16)
Chart 15: Global GDP, 1980-2020e (US$ billion, at current prices)
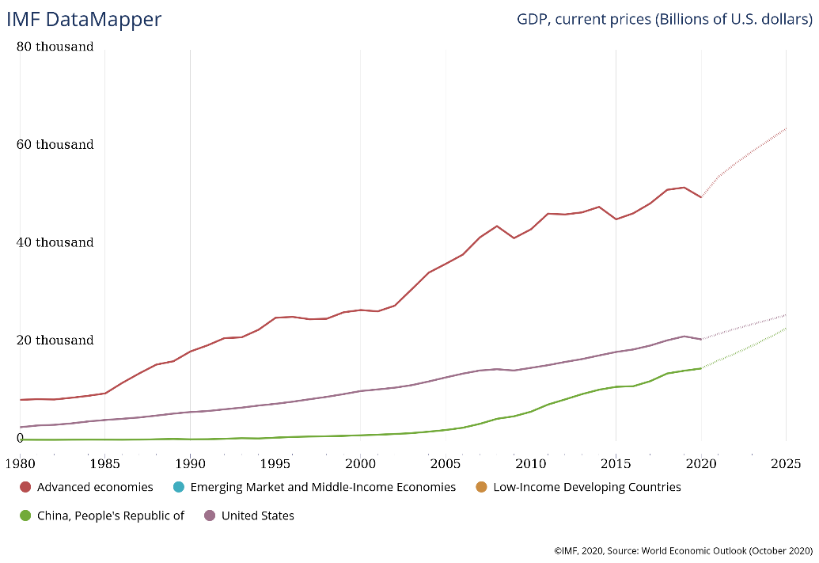
Chart 16: Global GDP per capita, 1980-2020e (US$, at current prices)
In any case, the US is aggressively counter-maneuvering with the most exaggerated approach being so-called decoupling although it remains to be seen how far this can go with their trade and investment so inter-linked.
As in 2008-09, China appears to again be taking up the global economic slack with its Keynesian spending offensive especially on infrastructure. China’s debt-driven economic offensive spurred imports of raw materials and commodities from underdeveloped countries and of goods and services from developed countries, providing a boost to their growth after the 2008-09 global crisis. This caused its debt to more than quadruple in the last decade. The expansive overseas Belt and Road Initiative (BRI) is an effort to augment this domestic effort further.
The Chinese economy is slowing today but looks to still be providing the same kind of boost, albeit to a lower degree and especially with the protracted economic crisis in general even before the pandemic. It remains to be seen how far and for how long this will be able to alleviating the stagnationary crisis.
Multiple pressures for ever-greater labor exploitation
The neoliberal era since the 1980s greatly intensified labor exploitation. There was first of all the vast expansion of the labor force for capitalist exploitation and of the global reserve army of labor with the opening up of China and the former Soviet bloc. This was complemented by the redoubled assault on trade unions and labor rights which greatly weakened the negotiating position of organized labor. The roll-back of labor rights gave way to greater flexibilization of work arrangements, while new technologies and work methods enabled greater regimentation in the work place.
All these resulted in increasingly depressed working class incomes, worse working conditions, and greater exploitation. The conditions of the working people continuously deteriorated after 2008/09 with austerity measures further reducing welfare and social spending. The biggest banks and corporations on the other hand were bailed out. The last decades have seen labor getting an even smaller share of national income.
The people are the worst affected by the pandemic health and economic shocks – small scale farmers, poor and low-income working class families, informal sectors, migrants, and indigenous peoples. The people in the most underdeveloped countries are the worst affected in having the lowest household incomes, weakest social programs, and governments with the least resources to respond. Underdeveloped economies hollowed-out by globalization were badly affected by collapsing commodity prices, displaced migrant workers and reduced remittances, and the interruption of globally-integrated manufacturing.
Mass protests of the people are already on the upsurge this year around the globe including many directly against governments – US, Britain, Argentina, Chile, Ecuador, Lebanon, Iraq, Hong Kong, the Philippines, Thailand, Indonesia, India, and many other countries. These follow waves of mass protests and demonstrations since last year across the globe on a wide range of issues that are historically unprecedented in frequency, scope and size; over a hundred major anti-government protests have erupted worldwide.
The pandemic is intensifying multiple pressures for labor exploitation and the capitalist appropriation of greater absolute and relative surplus value.
The bloating global reserve army of labor will force down worker wages and benefits further.
The overwhelming majority of the world’s workers are precariously employed with low wages or otherwise in informal, irregular, or part-time work. Aside from them are the hundreds of millions of jobless workers.
The International Labor Organization (ILO) estimated that the equivalent of 495 million jobs worth of working hours were lost around the world by the middle of 2020 due to the pandemic. Lower-middle-income countries were the hardest hit losing the equivalent of 240 million jobs. The ILO also estimates huge losses in labor incomes with a global decline of US$3.5 trillion or almost 11% already in just the first three quarters of 2020. Even with the supposed rebound in the third quarter, the equivalent of 345 million full-time jobs was still lost compared to the year before. The ILO also reported that 1.6 billion informal economy workers, or 76% of the world’s informal employment, were adversely affected by the crisis especially those in devastated micro and small enterprises.
World Bank researchers, using a poverty line of US$1.90 per day, estimate that the pandemic economic shock will push 131 million more people into extreme poverty, mostly in South Asia (82 million) and Sub-Saharan Africa (33 million). A higher poverty threshold of US$3.20 per day doubles the new poor to 257 million, again mostly in South Asia (183 million) and Sub-Saharan Africa (30 million). With the status quo at 759.2 million (using US$1.90 per day) or 1,898.5 million (US$3.20 per day), the number of poor increases to 890.2 million or as much as 2,155.5 million, respectively.
A UNU-WIDER paper however sees the number of poor rising by as much as 420-580 million people depending on the poverty threshold used – to 1,178 million (US$1.90 per day) or as much as 2,480 million (US$3.20 per day). The food security and nutrition of hundreds of millions are under threat – the ILO, FAO, IFAD and WHO already estimate that the 690 million undernourished people worldwide will reach some 822 million this year. They also estimate that nearly half of the world’s 3.3 billion workforce are at risk of losing their livelihoods.
Among workers, migrants are disproportionately facing wage cuts and job losses because of their vulnerable status. Those in informal sectors, lower-skilled jobs, and undocumented/irregulars are worst off. This bears down heavily on remittance-dependent households. The stock of international migrants worldwide is also likely to fall in 2020 for the first time in decades.
The World Bank projects remittance flows to low- and middle-income countries to decline by 7.2% in 2020 (to US$508 billion) and to decline by a further 7.5% in 2021 (to US$470 billion). This is much larger than the 5% decline in 2009 and the worst in recent memory. India, China, Mexico, Philippines and Egypt are the top remittance receiving countries in the world.
The pandemic is also being used to justify even greater labor exploitation. Work-at-home arrangements for instance that conflate paid work and reproductive time, while lowering corporate expenses, are being pushed. In advanced capitalist and backward countries around the world, such as Indonesia and the Philippines, brazenly anti-labor laws and regulations are being passed. These include lowering wages and benefits, extensions of working hours, and expansion of outsourcing schemes and other flexibilization of work. Thus, labor exploitation is drastically worsening not just from record joblessness bloating the reserve army of labor but because of government and government-supported measures.
The huge debt in the system is an additional driving factor here. Corporate debt needs to be repaid by extracting even more surplus value from the working people, which supports the increasingly fragile financial system, and will actually be used to enable even more debt.
Amid widespread and growing poverty, collapsing wages and unprecedented misery, the world’s richest are getting astronomically richer. The world’s 2,189 billionaires became even richer and increased their wealth by 27.5% to reach US$10.2 trillion by July 2020. Much of this came from buying assets cheaply as stock markets and prices collapsed, then accumulating wealth as values recovered. Fueled by unprecedented government stimulus packages, the recovery from bear markets is reportedly the fastest ever recorded. Billionaire wealth from technology and health grew the fastest.
In the US for instance, the combined net worth of its 644 billionaires grew by US$931 billion to US$3.9 trillion since March; this is nearly double the US$2.1 trillion in total wealth of the bottom half of the population or 165 million Americans. Their wealth bloated even as nearly 62 million Americans lost work since March, 25 million were collecting unemployment, and over 12 million lost their employer-sponsored health insurance. Some 22 million households reported not having enough food, with 14 million of these families having children.
The wealth of Amazon’s Jeff Bezos grew US$90 billion since March 2020 to US$203 billion by October, of Facebook’s Mark Zuckerberg by US$46.3 billion to US$101 billion, and of Tesla’s Elon Musk by US$68.2 billion to US$92.8 billion. The wealth of Alibaba’s Jack Ma increased by US$18.2 billion since the start of the year. Over the past year, China added another 257 billionaires.
The planet’s richest 30 billionaires now own more than the poorest four billion people or over half of the world’s population combined.
The world economy is ending 2020 on a bleak note for billions of the working people everywhere. The debilitating toll on their lives is set to continue in 2021 and, indeed, for the whole historical epoch that the inherently exploitative and anarchic capitalist system is not yet replaced by a more just and humane socialism. Authoritarianism and fascism will grow as the social and economic meltdown spreads – but so too will the strength of people organizing to take control of their lives and society. #
= = = = = = =
Kodao publishes IBON articles as part of a content-sharing agreement.